PC1 CUSUM Detector
- class source.detector.cusum.PC1_CUSUM_Detector(warmup_period: int = 10, delta: float = 0.5, threshold: float = 5.0, to_scale: bool = False)
Bases:
objectPC1-CUSUM Change Point Detector. A class to detect change points in sequential multivariate data using Principal Component Analysis (PCA) and the CUSUM algorithm.
- Parameters:
warmup_period (int) – The warmup period for the detector. Must be equal or greater than 10.
delta (float) – The reference value for the CUSUM algorithm.
threshold (float) – The threshold for detecting change points.
Initialize the PC1-CUSUM detector with the given parameters.
- Parameters:
warmup_period (int) – The warmup period for the detector. Must be equal or greater than 10.
delta (float) – The reference value for the CUSUM algorithm.
threshold (float) – The threshold for detecting change points.
to_scale (bool) – Whether to standardize the data before applying PCA.
- __init__(warmup_period: int = 10, delta: float = 0.5, threshold: float = 5.0, to_scale: bool = False)
Initialize the PC1-CUSUM detector with the given parameters.
- Parameters:
warmup_period (int) – The warmup period for the detector. Must be equal or greater than 10.
delta (float) – The reference value for the CUSUM algorithm.
threshold (float) – The threshold for detecting change points.
to_scale (bool) – Whether to standardize the data before applying PCA.
- detection(observations: float)
Process a row of observations, transform into PC1 and detect change points.
- Parameters:
observations (float) – A row of multivariate observations.
- get_contributions()
Retrieves the contributions of each feature to the detected change points.
- Returns:
list_contributions – A list of dictionaries containing feature contributions for each detected change point.
- Return type:
list
- offline_detection(data: ndarray)
Detects change points in the given data in an offline manner.
- Parameters:
data (numpy.ndarray) – Data points to be analyzed.
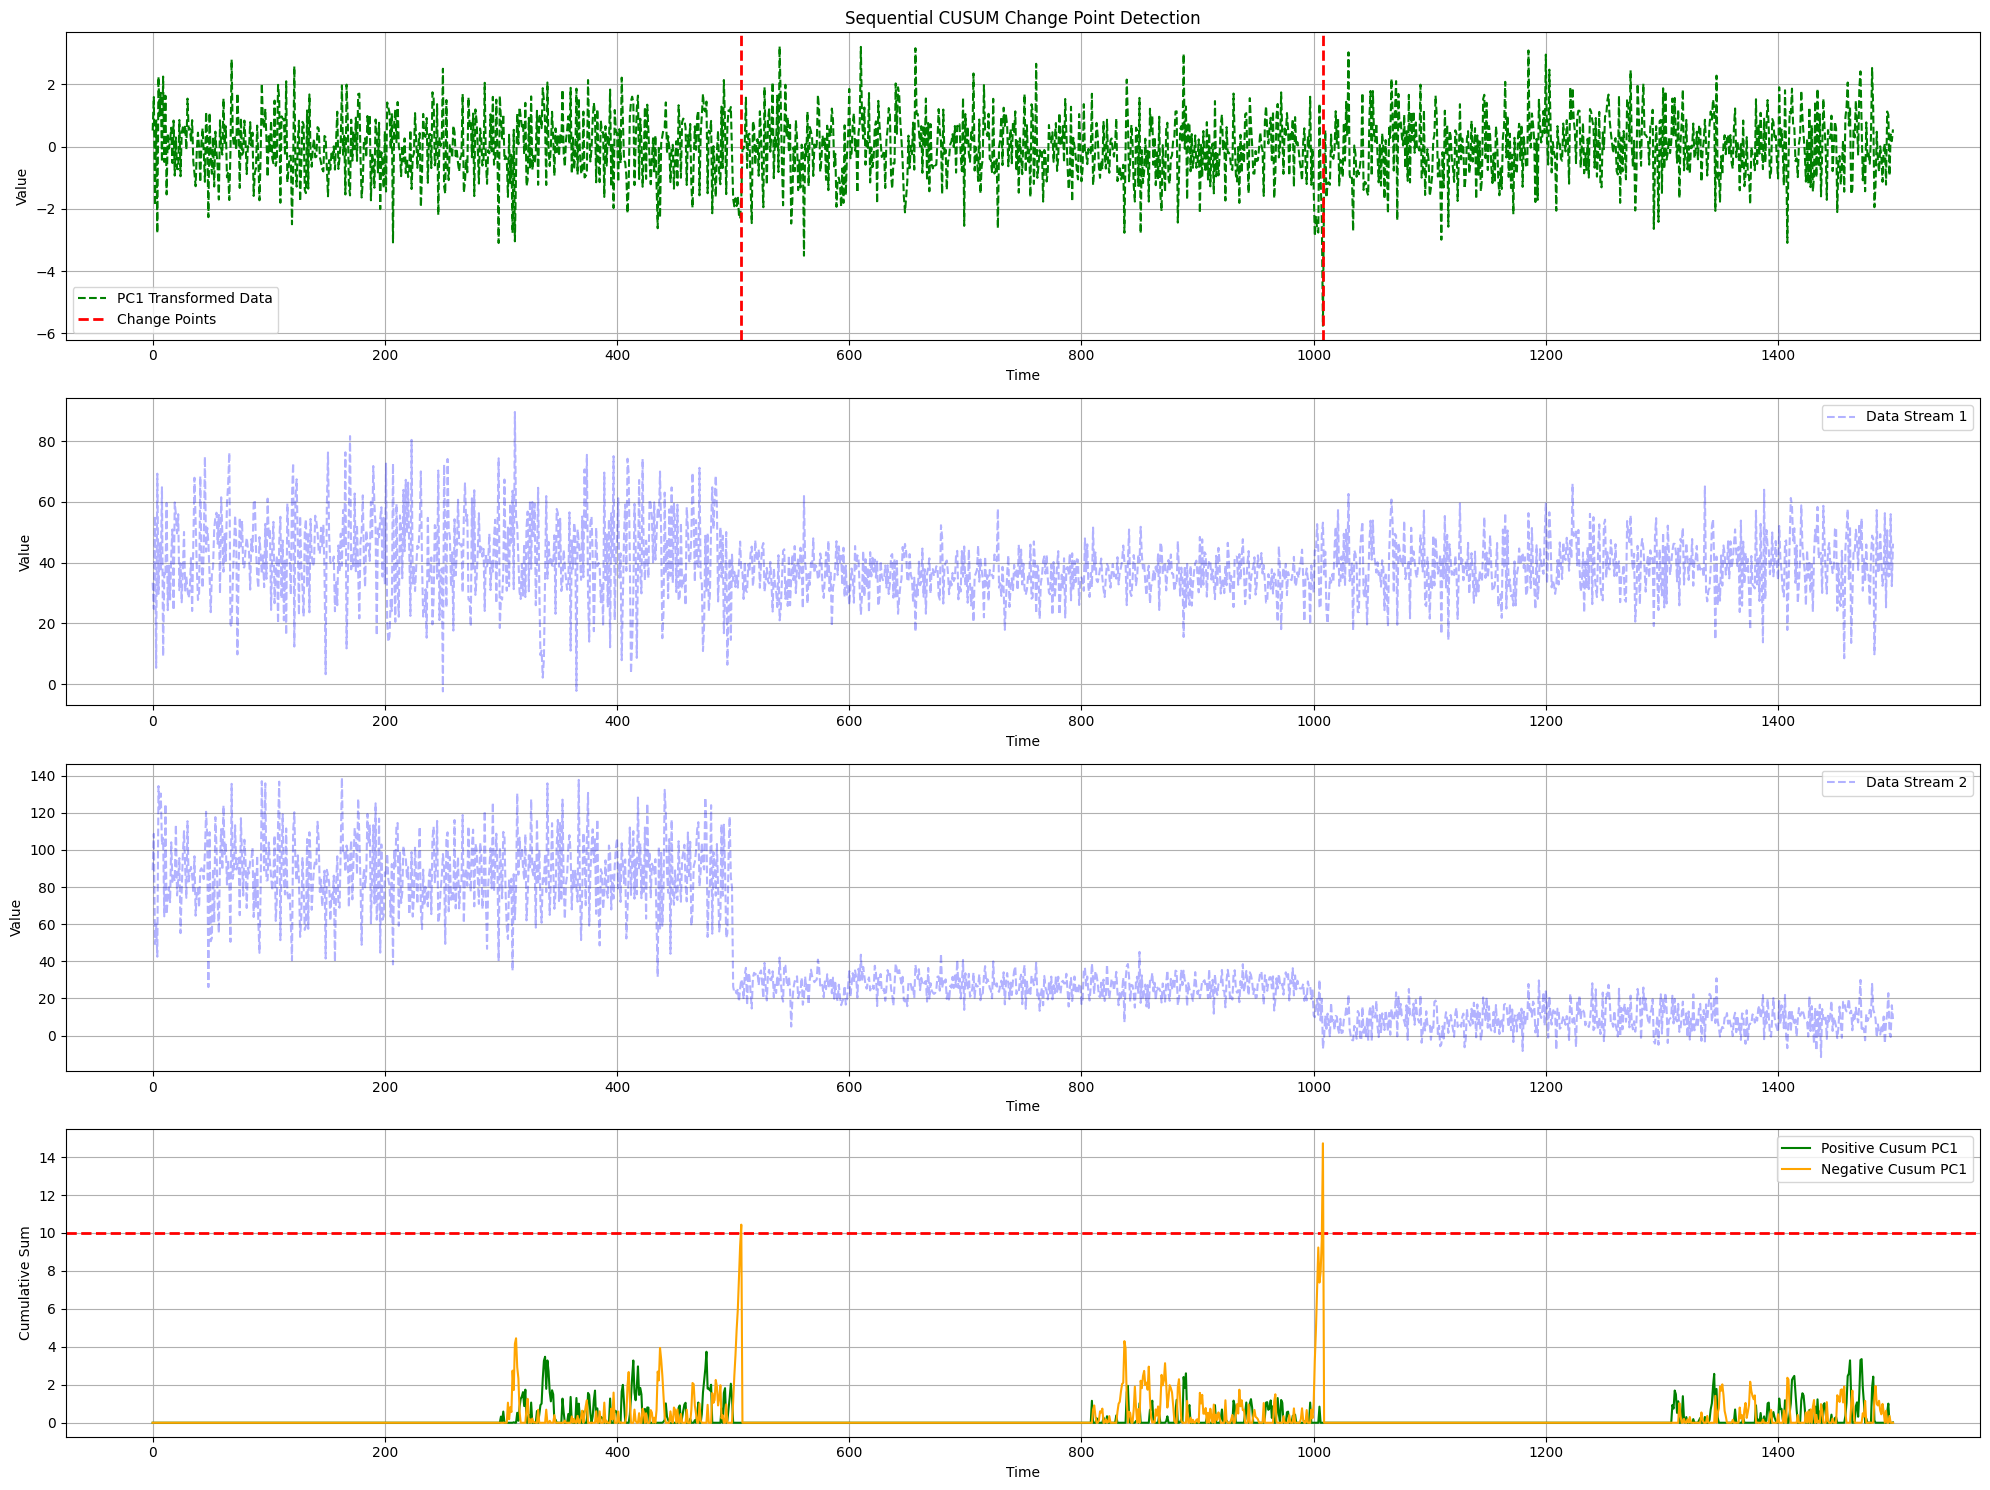
- plot_change_points(data_streams: array, change_points: list, pos_changes: list, neg_changes: list)
Plots data with detected change points and cumulative sums.
- Parameters:
data_streams (numpy.ndarray) – Original multivariate data points.
change_points (list) – List of detected change points.
pos_changes (list) – List of positive cumulative sums.
neg_changes (list) – List of negative cumulative sums.
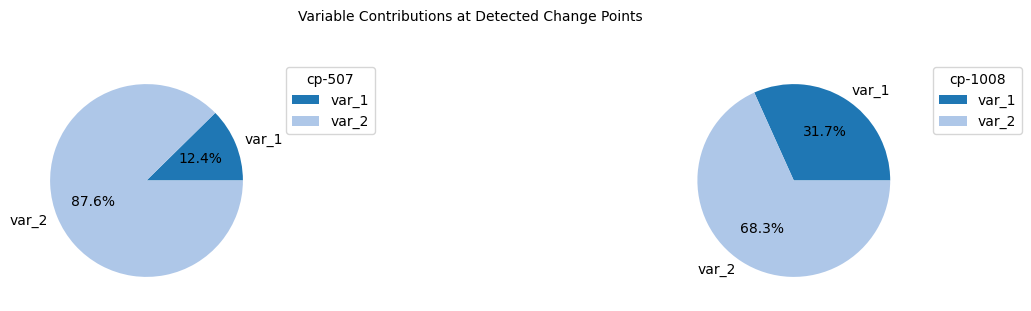
- plot_contributions(list_contributions: list)
Plots the contributions of each feature to the detected change points.
- Parameters:
list_contributions (list) – A list of dictionaries containing feature contributions for each detected change point.
Example Usage
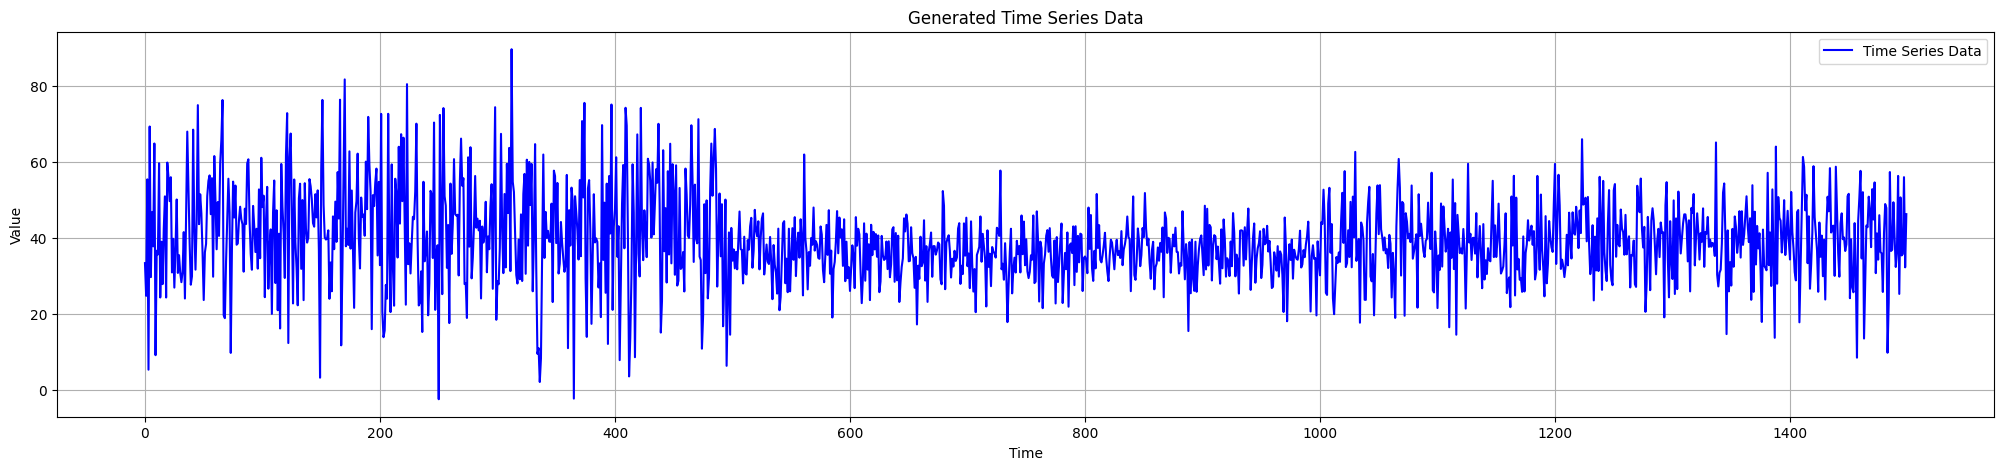
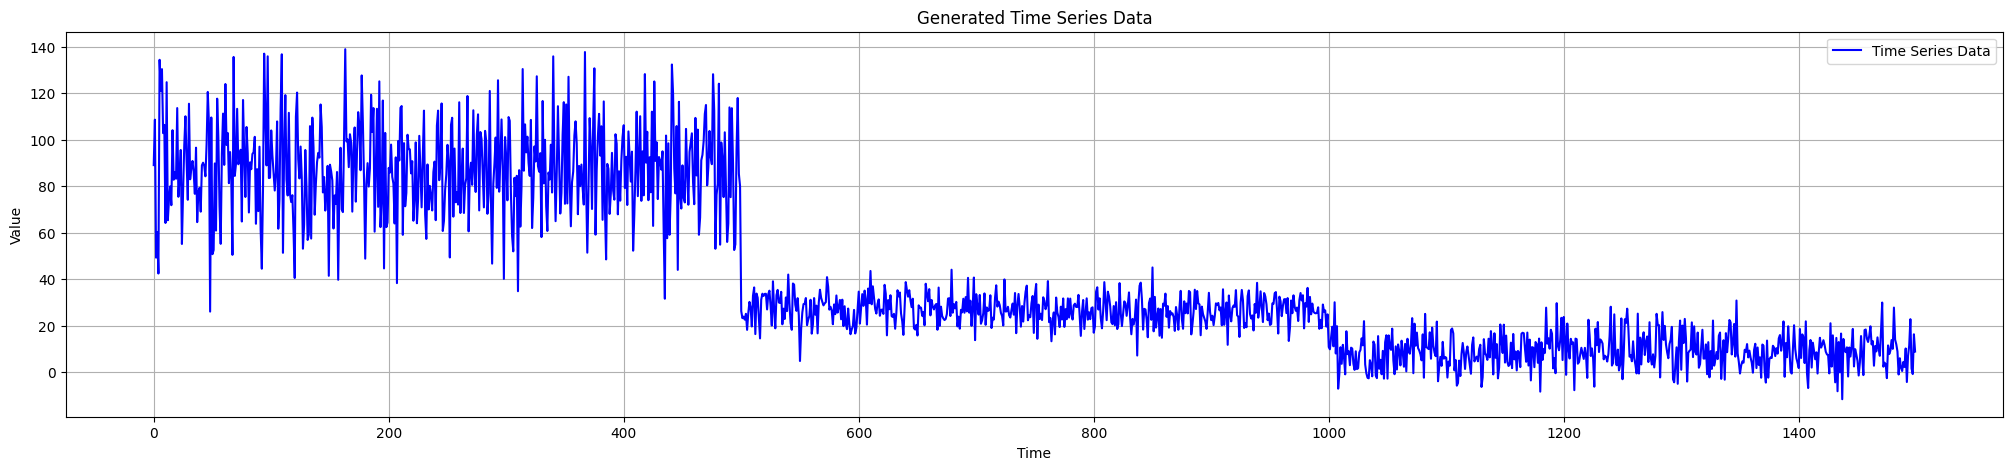
Generate multiple data streams
from source.generator.ds_generator import MultiDataStreams

# Generate Two Data Streams
dict_streams = [{"num_segments": 3,
                "segment_length": 1000,
                "change_point_type": "sudden_shift",
                    "seed": 2},
                {"num_segments": 6,
                    "segment_length": 500,
                    "change_point_type": "sudden_shift",
                    "seed": 11}]

# Initialize Data Streams Generator
many_data_streams = MultiDataStreams(dict_streams=dict_streams)
many_data_streams.generate_data_streams()
# Get Data Streams as Array
data_streams_arr = many_data_streams.get_data_streams_as_array()
Apply PC1-based CUSUM detector
from source.detector.cusum import PC1_CUSUM_Detector

# Initialize PC1-CUSUM Detector
pc1_detector = PC1_CUSUM_Detector(warmup_period=50, delta=0.5, threshold=8)
# Offline Detection
results = pc1_detector.offline_detection(data_streams_arr)

# Plot Change Points
pc1_detector.plot_change_points(data_streams=data_streams_arr,
                                    pos_changes=results['pos_changes'],
                                    neg_changes=results['neg_changes'],
                                    change_points=results['change_points'])
Plot Variable Contributions
# get contributions
list_contributions = pc1_detector.get_contributions()
# plot pie charts
pc1_detector.plot_contributions(list_contributions=list_contributions)