Low Pass Filter
The Low Pass Filter is a fundamental tool in signal processing used to remove high-frequency noise from a signal while preserving the low-frequency components. The filter is based on a recursive algorithm that continuously updates the filtered value based on the current input and the previous filtered value.
Low Pass Filter class
- class source.smoother.incremental.LowPassFilter(alpha: float = 0.999)
Bases:
objectLow-Pass Filter using Exponential Moving Average.
- Parameters:
alpha (float, optional) – Smoothing factor between 0 and 1.
Initialize the LowPassFilter object.
- Parameters:
alpha (float, optional) – Smoothing factor between 0 and 1.
- __init__(alpha: float = 0.999) None
Initialize the LowPassFilter object.
- Parameters:
alpha (float, optional) – Smoothing factor between 0 and 1.
- fit(observations: list[ndarray]) None
Fit the low-pass mean to a set of observations.
- Parameters:
observations (list of np.ndarray) – List of observation vectors.
- Returns:
list_smooth – List of low-pass means after each observation.
- Return type:
list of np.ndarray
- update(observation: ndarray) None
Update the low-pass mean with a new observation.
- Parameters:
observation (np.ndarray) – New observation to update the mean.
Example Usage
import numpy as np
import matplotlib.pyplot as plt
from source.generator.change_point_generator import ChangePointGenerator
from source.smoother.incremental import LowPassFilter
# Generate time series data with change points
generator = ChangePointGenerator(num_segments=3,
segment_length=1000,
change_point_type='sudden_shift',
seed=12) # set seed for reproducibility
generator.generate_data()
observations = generator.get_data()
# create the model
model = LowPassFilter(alpha=0.99)
list_filtered = []
# update the model with each observation
for observation in observations:
model.update(np.array([observation]))
list_filtered.append(model.lowpass_mean)
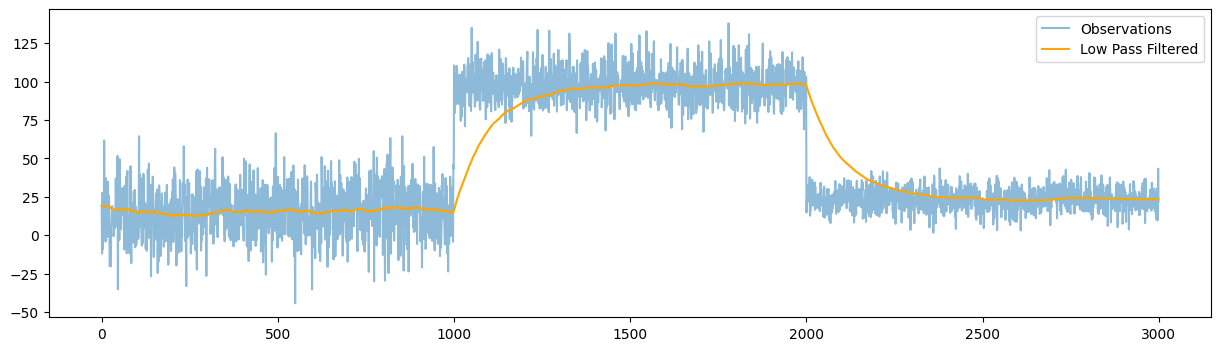
# plot the filtered values
plt.figure(figsize=(15, 4))
plt.plot(observations, label='Observations')
plt.plot(list_filtered, label='Low Pass Filtered', color='orange')
plt.legend()
plt.show()
Plotting