Change Point Generator
This module contains the class for generating synthetic data with different types of change points.
Change Point Generator Class
- class source.generator.change_point_generator.ChangePointGenerator(num_segments=3, segment_length=500, change_point_type='sudden_shift', seed=42)
Bases:
objectA class to generate time series data with different types of change points.
- Parameters:
num_segments (int) – Number of segments in the time series data.
segment_length (int) – Length of each segment.
change_point_type (str) – Type of change point to introduce (‘sudden_shift’, ‘gradual_drift’, ‘periodic_change’).
seed (int) – Random seed for reproducibility.
Initializes the ChangePointGenerator with the specified parameters.
- Parameters:
num_segments (int) – Number of segments in the time series data.
segment_length (int) – Length of each segment.
change_point_type (str) – Type of change point to introduce (‘sudden_shift’, ‘gradual_drift’, ‘periodic_change’).
seed (int) – Random seed for reproducibility.
- __init__(num_segments=3, segment_length=500, change_point_type='sudden_shift', seed=42)
Initializes the ChangePointGenerator with the specified parameters.
- Parameters:
num_segments (int) – Number of segments in the time series data.
segment_length (int) – Length of each segment.
change_point_type (str) – Type of change point to introduce (‘sudden_shift’, ‘gradual_drift’, ‘periodic_change’).
seed (int) – Random seed for reproducibility.
- add_gradual_drift(mean_start, mean_end, std_dev, change_point_index)
Add a gradual drift change point to the data.
- Parameters:
mean_start (float) – Mean value at the start of the drift.
mean_end (float) – Mean value at the end of the drift.
std_dev (float) – Standard deviation during the drift.
change_point_index (int) – Index at which the drift starts.
- add_periodic_change(amplitude, period, std_dev, change_point_index)
Add a periodic change point to the data.
- Parameters:
amplitude (float) – Amplitude of the periodic change.
period (float) – Period of the periodic change.
std_dev (float) – Standard deviation during the periodic change.
change_point_index (int) – Index at which the periodic change starts.
- add_sudden_shift(mean_before, mean_after, std_dev_before, std_dev_after, change_point_index)
Add a sudden shift change point to the data.
- Parameters:
mean_before (float) – Mean value before the change point.
mean_after (float) – Mean value after the change point.
std_dev_before (float) – Standard deviation before the change point.
std_dev_after (float) – Standard deviation after the change point.
change_point_index (int) – Index at which the change point occurs.
- generate_block_nans(percentage, min_block_size, max_block_size)
Generate data with NaN values in contiguous blocks.
- Parameters:
percentage (float) – Percentage of the data to be replaced with NaNs (between 0 and 1).
min_block_size (int) – Minimum size of each block of NaNs.
max_block_size (int) – Maximum size of each block of NaNs.
- generate_data()
Generate time series data with different types of change points.
- generate_point_nans(percentage)
Generate data with a specified percentage of NaN values.
- Parameters:
percentage (float) – Percentage of NaN values to introduce in the data (between 0 and 1).
- Returns:
data_with_nans – Data with NaN values introduced.
- Return type:
numpy array
- get_data()
Returns the generated time series data.
- Returns:
data – The generated time series data.
- Return type:
numpy array
- plot_data()
Plot the generated time series data.
- plot_data_with_nans(data_with_nans)
Plot the generated time series data with NaN values.
- Parameters:
data_with_nans (numpy array) – Data with NaN values to plot.
Example Usage
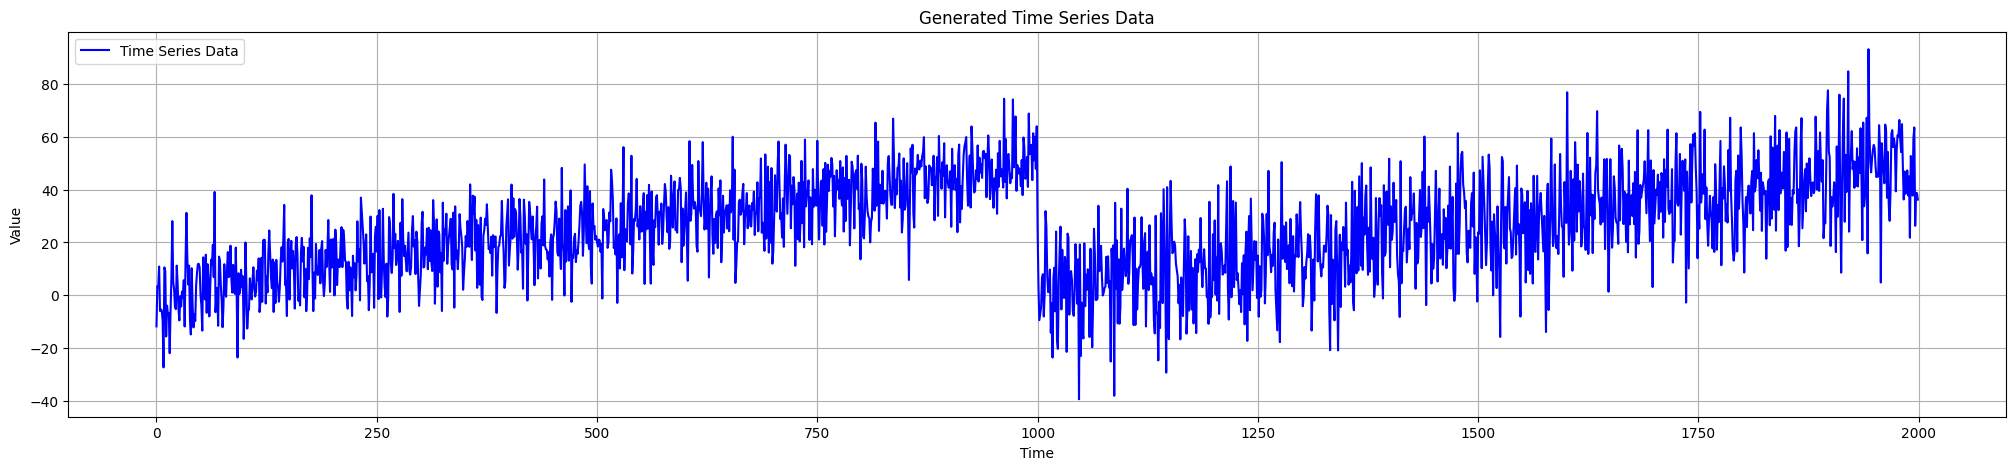
Generate Data
from source.generator.change_point_generator import ChangePointGenerator

# Initialize generator
generator = ChangePointGenerator(num_segments=2, segment_length=1000, change_point_type='gradual_drift')

# Generate synthetic data
generator.generate_data()

# Plot generated data
generator.plot_data()
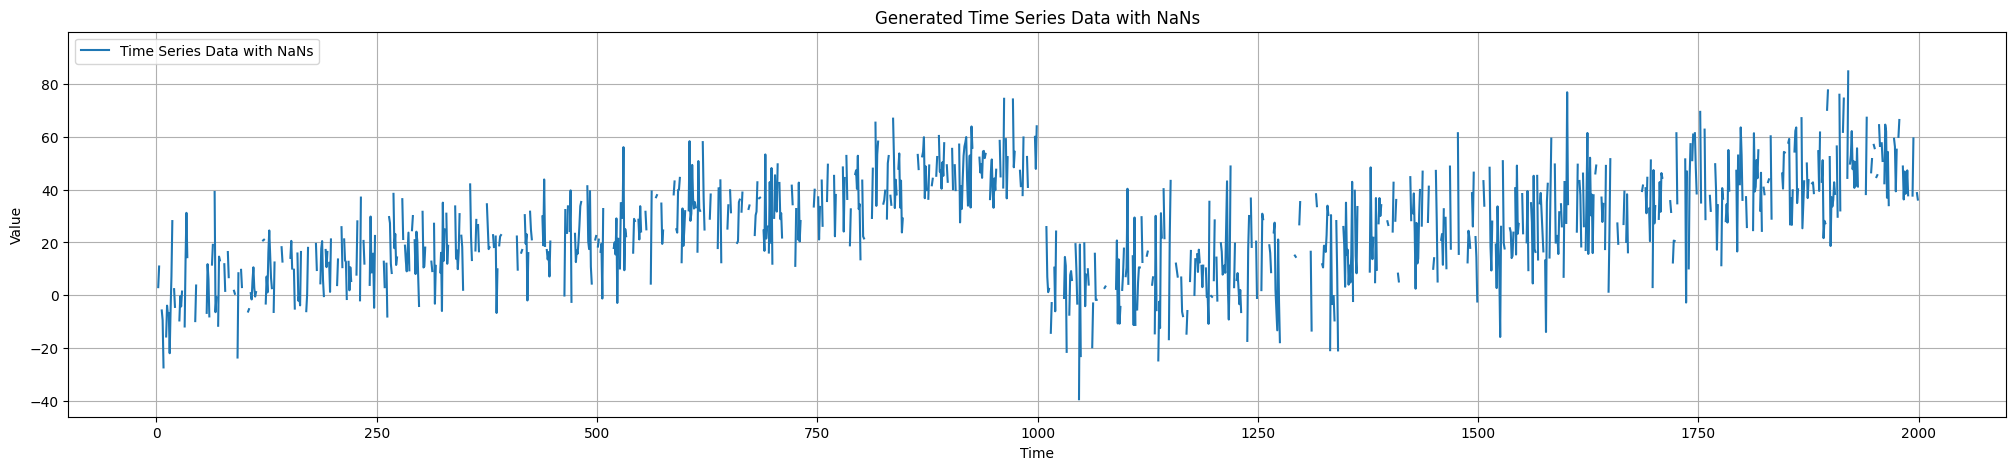
With Point Missingness
# Add point missingness
nan_percentage = 0.25
data_with_nans = generator.generate_point_nans(nan_percentage)

# Plot data with missing values
generator.plot_data_with_nans(data_with_nans)
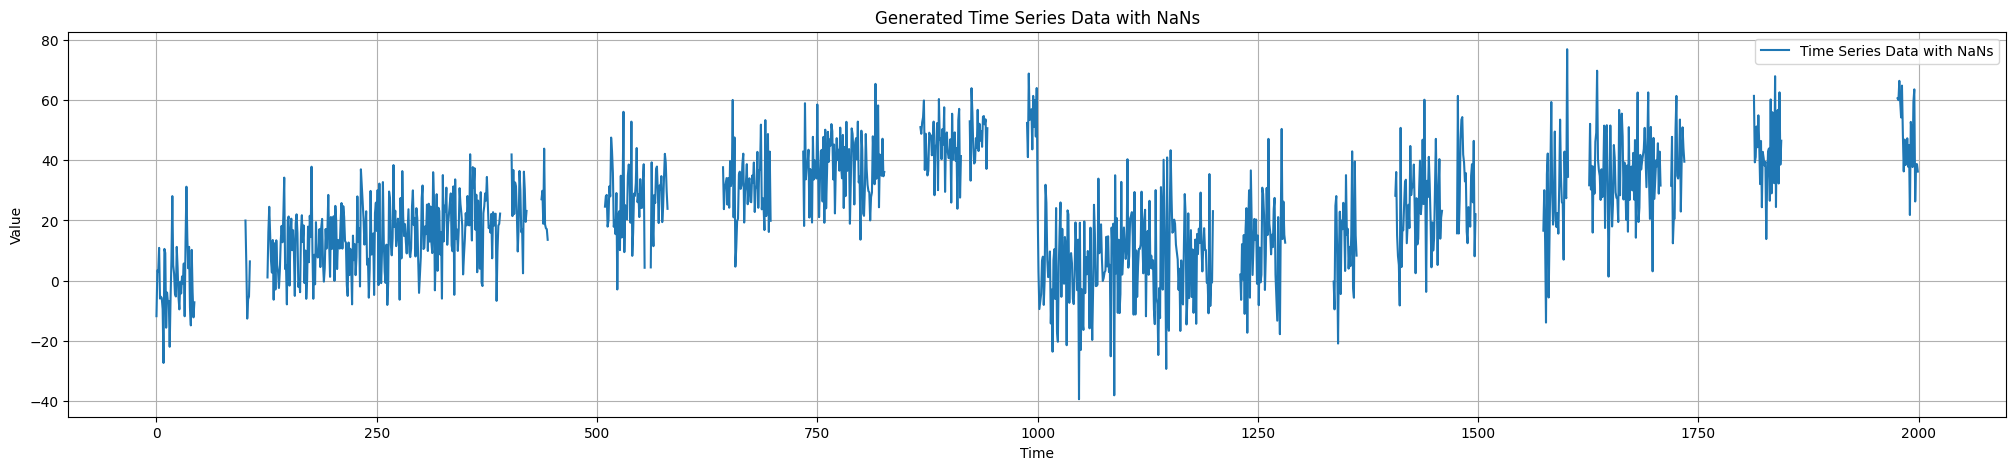
With Block Missingness
# Add block missingness
nan_percentage = 0.1
min_block_size=2
max_block_size=50
data_with_nans = generator.generate_block_nans(nan_percentage, min_block_size, max_block_size)

# Plot data with missing values
generator.plot_data_with_nans(data_with_nans)