Probabilistic CUSUM Detector Class
- class source.detector.cusum.ProbCUSUM_Detector(warmup_period: int = 10, threshold_probability: float = 0.001)
Bases:
CusumProbabilistic CUSUM Change Point Detector. A class to detect change points in sequential data using a probabilistic approach based on the CUSUM algorithm.
- Parameters:
warmup_period (int) – The warmup period for the detector. Must be equal or greater than 10.
threshold_probability (float) – The threshold probability for detecting a change point. Must be between 0 and 1.
Initializes the Probabilistic CUSUM Detector with the specified parameters.
- Parameters:
warmup_period (int) – The warmup period for the detector. Must be equal or greater than 10.
threshold_probability (float) – The threshold probability for detecting a change point. Must be between 0 and 1.
- Raises:
ValueError – If warmup_period < 10 or threshold_probability is not between 0 and 1.
- __init__(warmup_period: int = 10, threshold_probability: float = 0.001)
Initializes the Probabilistic CUSUM Detector with the specified parameters.
- Parameters:
warmup_period (int) – The warmup period for the detector. Must be equal or greater than 10.
threshold_probability (float) – The threshold probability for detecting a change point. Must be between 0 and 1.
- Raises:
ValueError – If warmup_period < 10 or threshold_probability is not between 0 and 1.
- detection(observation: float)
Predicts the probability of a change point in the next observation.
- Parameters:
observation (float) – The next data point to predict.
- Returns:
probability (float) – The probability of a change point.
is_changepoint (bool) – Indicates if a change point is detected.
- offline_detection(data: ndarray)
Detects change points in the given data in an offline manner.
- Parameters:
data (numpy.ndarray) – Data points to be analyzed.
- Returns:
results – A dictionary containing: - ‘probabilities’: numpy.ndarray of probabilities for each observation. - ‘is_drift’: list of booleans indicating detected change points. - ‘change_points’: numpy.ndarray of detected change point indices.
- Return type:
dict
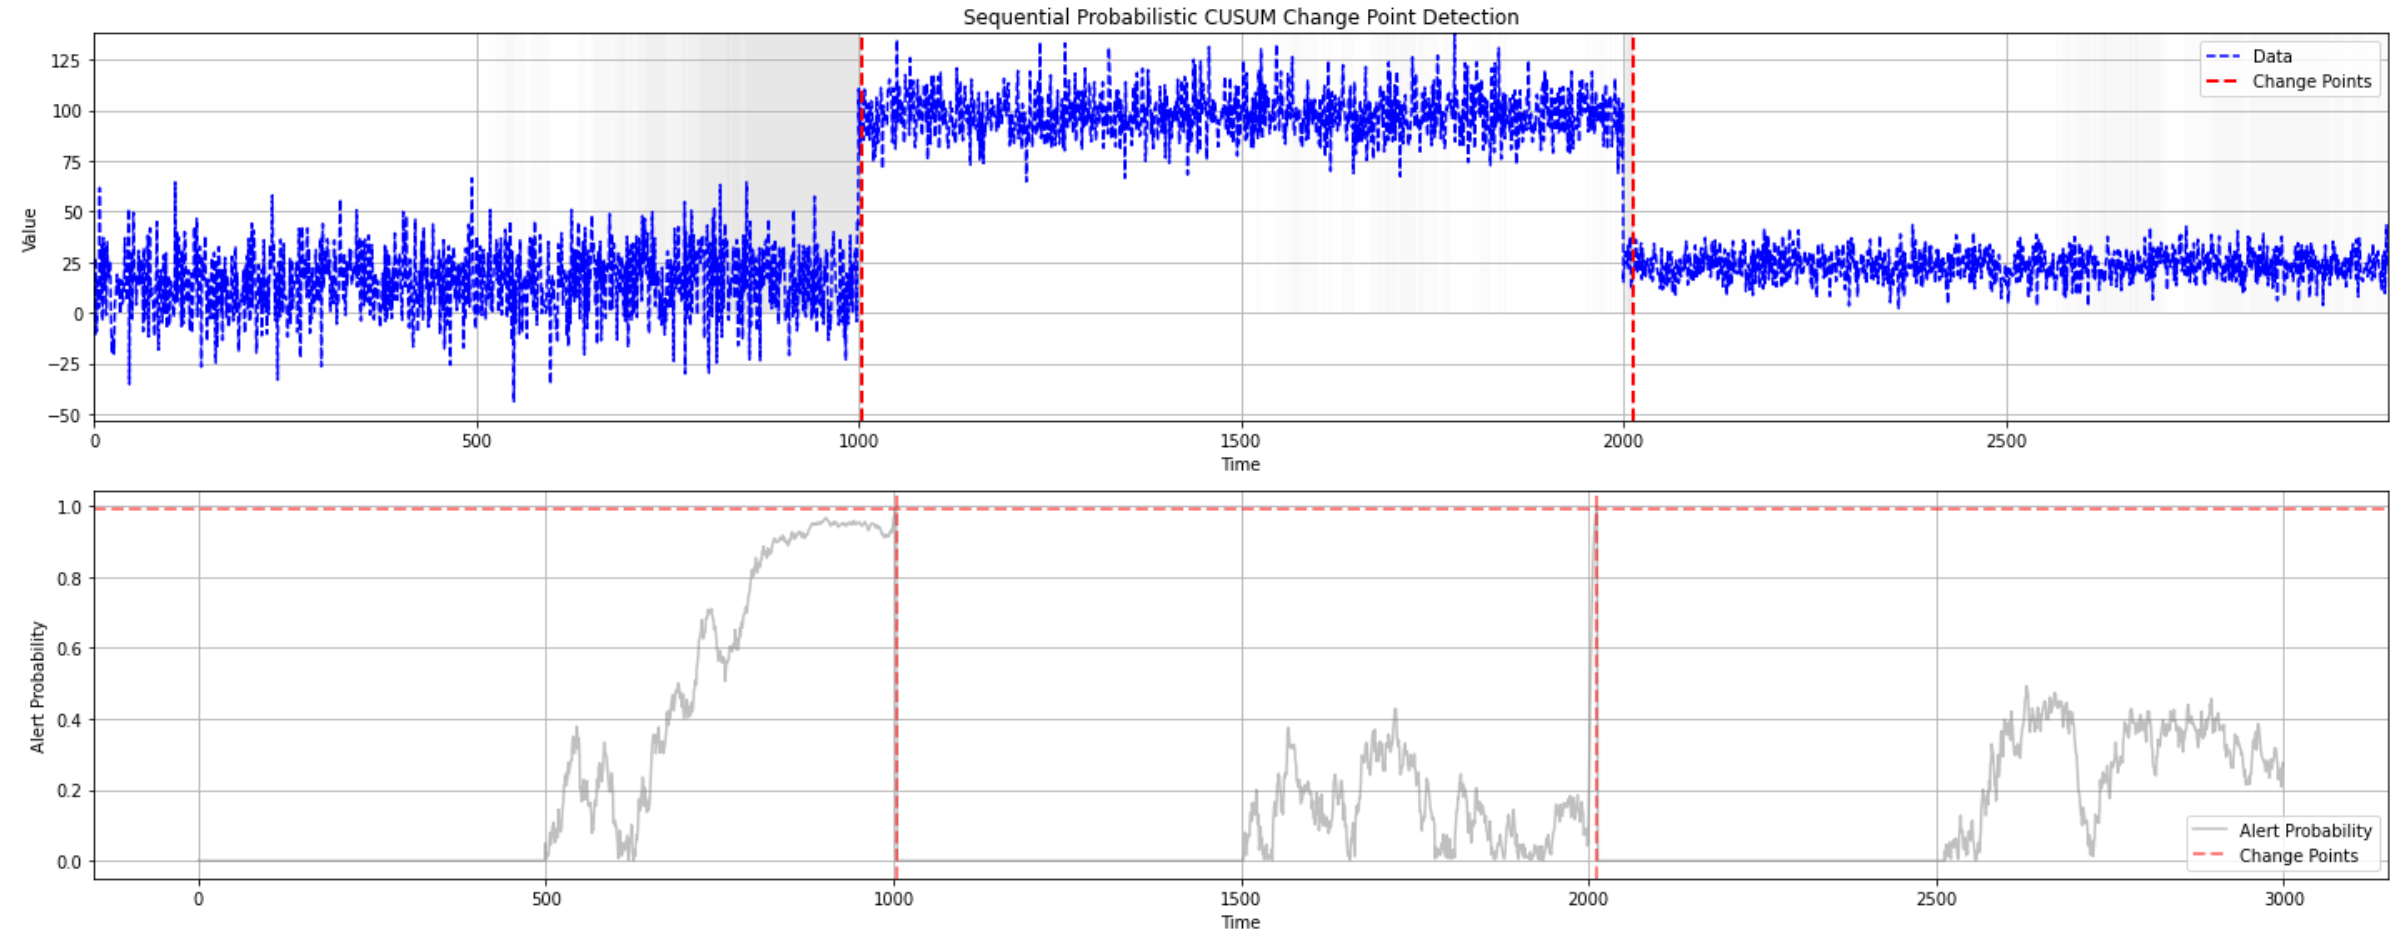
- plot_change_points(data: ndarray, change_points: list, probabilities: list)
Plots data with detected change points and probabilities.
- Parameters:
data (numpy.ndarray) – Original data points.
change_points (list) – List of detected change points.
probabilities (list) – List of probabilities associated with each data point.
Examples
Instance-based Detection
from source.detector.cusum import ProbCUSUM_Detector

detector = ProbCUSUM_Detector(warmup_period=10, threshold_probability=0.01)
data_stream = np.concatenate([np.random.normal(0, 1, 100),
                    np.random.normal(5, 1, 100)])
for data in data_stream:
    prob, is_change = detector.detection(data)
    print(f"Change Detected: {is_change} \n -Probability: {prob[0]}")
Batch-based Detection
from source.detector.cusum import ProbCUSUM_Detector

detector = ProbCUSUM_Detector(warmup_period=10, threshold_probability=0.01)
data = np.concatenate([np.random.normal(0, 1, 100),
                    np.random.normal(5, 1, 100)])
results = detector.offline_detection(data)
detector.plot_change_points(data,
                            results["change_points"],
                            results["probabilities"])
Plotting