Recursive Average Filter
The Recursive Average Filter is a simple yet effective signal-processing technique that incrementally computes the average when the data volume is too large to process in a single pass or when data arrive as a stream.
Recursive Average Filter classes
- class source.smoother.incremental.RecursiveAverage
Bases:
objectRecursive Average Filter for incremental average computation.
Initialize the RecursiveAverage object.
- __init__() None
Initialize the RecursiveAverage object.
- fit(observations: list[ndarray]) None
Fit the recursive mean to a set of observations.
- Parameters:
observations (list of np.ndarray) – List of observation vectors.
- Returns:
list_smooth – List of recursive means after each observation.
- Return type:
list of np.ndarray
- update(observation: ndarray) None
Update the recursive mean with a new observation.
- Parameters:
observation (np.ndarray) – New observation to update the mean.
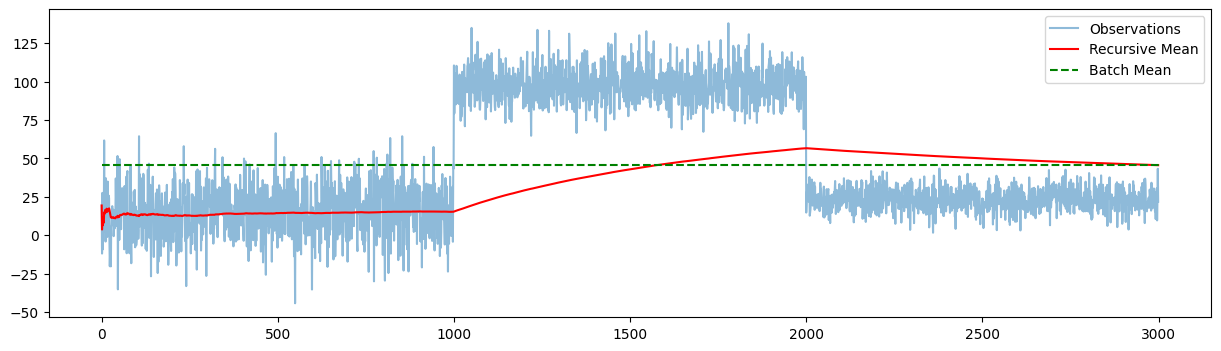
Example Usage
import numpy as np
import matplotlib.pyplot as plt
from source.generator.change_point_generator import ChangePointGenerator
from source.smoother.incremental import RecursiveAverage

# Generate time series data with change points
generator = ChangePointGenerator(num_segments=3,
                                 segment_length=1000,
                                 change_point_type='sudden_shift',
                                 seed=12)  # set seed for reproducibility
generator.generate_data()
observations = generator.get_data()

# create the model
model = RecursiveAverage()
list_means = []
# update the model with each observation
for observation in observations:
   model.update(np.array([observation]))
   list_means.append(model.recursive_mean)

# verify that the final recursive mean matches the batch mean
round(model.recursive_mean, 3) == round(np.mean(observations),3)

# plot the means: batch mean vs recursive mean
plt.figure(figsize=(15, 4))
plt.plot(observations, label='Observations')
plt.plot(list_means, label='Recursive Mean', color='red')
plt.hlines(np.mean(observations), 0, len(observations), colors='green', label='Batch Mean')
plt.legend()
plt.show()
Plotting