Rolling Average Filter
The Rolling Average Filter is a simple yet effective technique for signal-processing and time series analysis to smooth out short-term fluctuations and highlight longer-term trends or cycles. It works by compinting the average over a rolling window of the most recent data points.
Recursive Average Filter classes
- class source.smoother.incremental.RollingAverageFilter(window: int = 3)
Bases:
objectRolling Average Filter algorithm for filtering out high frequency noise.
- Parameters:
window (int, optional) – Size of the moving window.
Initialize the RollingAverageFilter object.
- Parameters:
window (int, optional) – Size of the moving window.
- __init__(window: int = 3) None
Initialize the RollingAverageFilter object.
- Parameters:
window (int, optional) – Size of the moving window.
- fit(observations: list[ndarray])
Fit the model to a set of observations.
- Parameters:
observations (list of np.ndarray) – List of observation vectors.
- Returns:
list_smooth – List of moving means after each observation.
- Return type:
list of np.ndarray
- update(observation: ndarray) None
Update the model with the new observation.
- Parameters:
observation (np.ndarray) – New observation to update the mean.
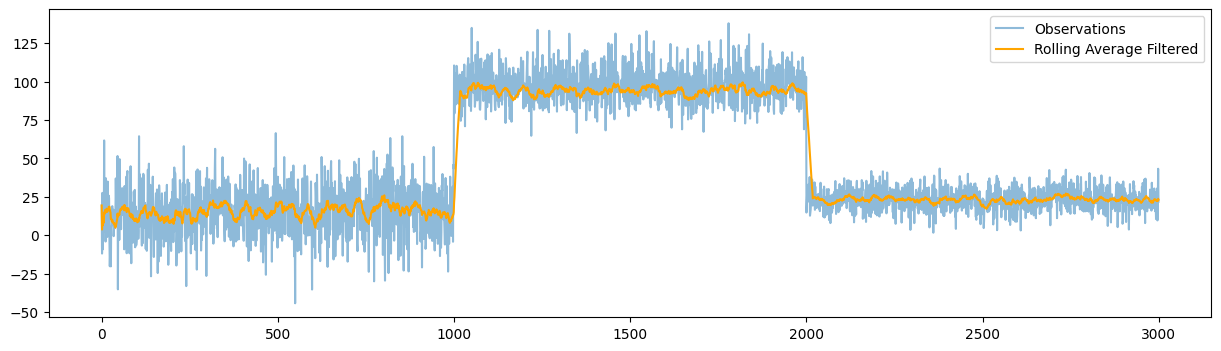
Example Usage
import numpy as np
import matplotlib.pyplot as plt
from source.generator.change_point_generator import ChangePointGenerator
from source.smoother.incremental import RollingAverageFilter

# Generate time series data with change points
generator = ChangePointGenerator(num_segments=3,
                                 segment_length=1000,
                                 change_point_type='sudden_shift',
                                 seed=12)  # set seed for reproducibility
generator.generate_data()
observations = generator.get_data()

model = RollingAverageFilter(window=20)

# create the model
model = RollingAverageFilter(window=50)
list_roll_means = []
# update the model with each observation
for observation in observations:
   model.update(np.array([observation]))
   list_roll_means.append(model.moving_mean)


# plot the means: batch mean vs recursive mean
plt.figure(figsize=(15, 4))
plt.plot(observations, label='Observations', alpha=0.5)
plt.plot(list_roll_means, label='Rolling Moving Average', color='orange')
plt.legend()
plt.show()
Plotting